

StandardSSC
-
 Data of a StandardSSC
Your requirements
As a producer of plant protection products or seeds you want to compare sites on the basis of objective satellite image information, for you need to prove that, may be phase-delayed, the biomass’ development of the host plants is similar.
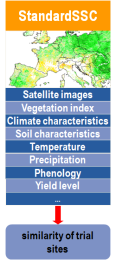
content of a StandardSSC
A standardSSC verifies whether two growing sites are similar or not.
It is based on the analysis of purpose-processed satellite image data and additionally on the analysis of the parameters specified in the EPPO guidelines, such as
-
climate and soil characteristics
-
temperature
-
precipitation
-
data on growth phases (phenology)
-
yield data
-
etc.
These additional data are for our agronomists, in addition to the biomass and vitality development of the host plants, the basis for the assessment leading to their statement that the compared sites are “similar” or “not similar”.
The periods are examined in which the plant protection product is applied. This produces a very fine instrument that is clearly superior to the conventional climate data. Climatic divergent sites may indeed have a similar development of the host plants in particular phenology phases.
Due to the time shifting of phenology phases between both sites, different periods can be compared. This is for example regularly the case when sites in the northern and southern hemisphere are to be compared.
For both sites the satellite image data are analysed with regard to the similarity of level and development of biomass and vitality. As an indicator, the vegetation index NDVI is analysed.
This analysis is complemented by the analysis of the parameters stipulated by the EPPO for the elaboration of a BAD. These can be
-
Distribution and amount of rainfall
-
Amount and deviation of daily temperatures
-
Similarity or differences in crop yield levels
-
Dew point developing
-
Etc.
-
-
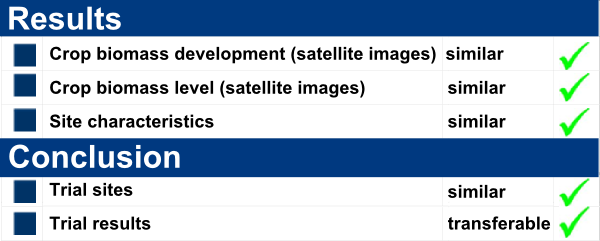
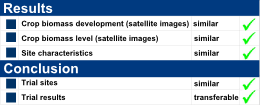 Positive outcome of a StandardSSC
Your certificate contains
-
the regional cut-outs of the processed satellite images which are artificially coloured by the processing algorithms of our satellite image and IT professionals in order to display the changes in the biomass and its vitality. A legend explains the different colours.
-
the analysis of the vegetation index curves of both sites for the periods under examination, with the indication of the possible shift in the phenology phases.
-
the discussion and evaluation of the phenomena showed by the satellite images and the additional EPPO parameters. Our experienced agronomists perform all analyses most meticulously.
-
for each pair of sites, the comprehensive assessment of our experts that the sites are “similar” or “not similar”.
-