

A computer-aided method for proving the similarity of field trial sites
-
For the purpose of transferring trial results from one growing site to another within in the scope of plant protection product registration in the EU, it must be assured that the pest and respective the crop show a similar development.
Indicators for this are site specific climatic factors, soil characteristics, height above sea level as well as cultivation practices. These parameters influence the growth of crops and the sensitivity for infestation by pests.
-
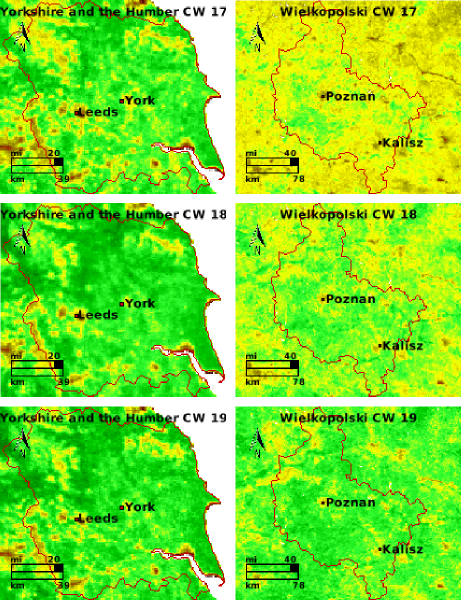
 Comparison of 2 sites
Beside the possibility of comparing these indirect indicators, the measurement of the crop growth itself can be applied too, with very accurate results.
The NDVI (Normalized Difference Vegetation Index) is a scientifically proved parameter which describes the biomass and vitality (chlorophyll and water content) of vegetation. NDVI-values are derived from satellite images. Long-term time series of NDVI-values extracted from satellite images are available since 1995. Mean values calculated from these time series eliminate yearly variations on the one hand and account for climatic change on the other hand. This dynamic can not be displayed on static climate maps.
Computer-aided technologies provide the ability to easily compare the course and the intensity of crop development derived from satellite images between different agricultural sites. Selectively, those stages of crop development can be compared in which the pest is expected to affect the crop.
If the crop development then is proved to be similar, the trial results are transferable.
The evident advantages of this method are experienced in
- the direct measurement of the crop development itself,
- the easy, homogeneous and world-wide availability of the objectively measured values from satellite images,
- a ready-to-use method for comparing trial sites
- the fact that all relevant parameters recommended by the EPPO guidelines are taken into account for each specific indication
With a delivery time of about four weeks, the analysis of plant growth by means of satellite imagery requires a far shorter production time than the carrying out of field trials.