

Site Similarity Certification: A new service for the Agroindustry
Optimizing zonal trial planning and substituting agricultural field trials
-
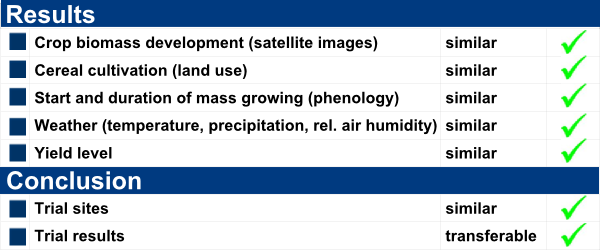
 similar or not similar?
Our service "Site Similarity Certification" (SSC) proves the similarity of cropping sites by the use of satellite imagery.
As part of a Biological Assessment Dossier for the purpose of the registration of a plant protection product or a new seed variety, SSC can be used for:
-
-
Optimizing the strategic location of trial sites following the assessment of dissimilarity or the assessment of substitutability because of similarity
-
Bridging the lack of field trial data
-
Substituting field trials
-
Assessing the similarity of sites in the northern and southern hemisphere for shortening of field trials to only one year
-
Identifying trial sites with similar site characteristics (1:n)
-
Proving the similarity of sites across countries and the boundaries of zones (1:1)
-
-
Find further detailed information about
We would be pleased to inform you personally and individually at any time . Do not hesitate to contact us.